How to Reduce PostgreSQL Memory Usage and Cut Your Cloud Bill in Half
Most teams answer a memory alert with a bigger server. We cut this one in half, and the cloud bill went from $630 to $320 a month.
One of our customers cut their cloud bill in half with one simple setting and a small tweak to their tenant clean-up jobs.
The hardest part was PostgreSQL. Their database server kept emailing them memory alerts: 93%, 92% and 91% in a single day.
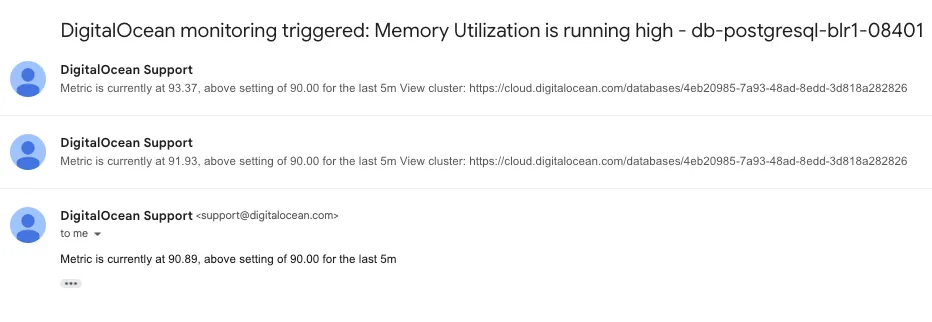
The usual answer to an alert like that is a bigger server. We did the reverse: we cut their PostgreSQL instance memory in half and changed one connection pooler setting. They have not had a memory alert since.
Here is how to reduce PostgreSQL memory usage the same way.
The setup: one schema per tenant
Every tenant gets its own schema. Their database holds 432 schemas and 82,058 tables. Their apps connect through a connection pooler, which keeps a set of connections open to PostgreSQL and shares them between clients.
Why PostgreSQL memory usage kept growing
Every PostgreSQL connection keeps a private cache of the tables it has used: their columns, indexes and constraints. PostgreSQL never trims this cache. It is freed only when the connection closes.
In most databases this does not matter, because there are only a few hundred tables. They have 82,058. A pooled connection serves many tenants, so over a day it touches thousands of tables, and its cache keeps growing.
Their pooler kept each connection open for 24 hours. Every connection in the pool carried a full day of cache, and together they used most of the server’s memory.
How to reduce PostgreSQL memory usage: recycle pooled connections
We told the pooler to retire connections after 10 minutes. Most poolers
have this setting. In PgBouncer it is
server_lifetime, in
seconds:
[pgbouncer]
server_lifetime = 600   ; 10 minutes (PgBouncer's default is 3600, one hour)
When a connection reaches that age, the pooler closes it and opens a fresh one when it is needed. A fresh connection starts with an empty cache. The cost is one reconnect per connection every 10 minutes, which nobody notices.
PgBouncer only retires a connection when no client is using it, so this works best in transaction pooling mode.
How to check PostgreSQL memory per connection
This shows how much catalog cache your current session holds, using the
pg_backend_memory_contexts
view. It works on PostgreSQL 14 and later, and needs a superuser or a role with
pg_read_all_stats:
SELECT pg_size_pretty(total_bytes) AS catalog_cache
FROM   pg_backend_memory_contexts
WHERE  name = 'CacheMemoryContext';
Run it in a new session, query a few hundred tables, and run it again. In our test on PostgreSQL 18, touching 1,000 small tables took one session from 512 kB to about 8 MB. Wider tables with more indexes use more, and the query leaves out a few related caches, so the real figure is a little higher.
The result: lower memory, lower cloud bill
| Before | After (half the memory) | |
|---|---|---|
| Connection lifetime | 24 hours | 10 minutes |
| Memory used | 93% | 50% |
If you run one schema per tenant and want to reduce PostgreSQL memory usage or your cloud bill, check how long your pooler keeps connections open. It may be the difference between paying for a bigger server and getting by on a smaller one.
For another PostgreSQL memory setting worth checking, see how we stopped one function spilling to disk with ALTER FUNCTION SET work_mem.
Want to know exactly how we did it? Email the founder and we will walk you through it. For more real cases like this one, subscribe to the newsletter and get the next one in your inbox.
Keep reading
All articles →The Cost of Storing and Indexing Embeddings in pgvector
What does it cost to store and index embeddings in pgvector? Four costs priced per vector, and why keeping the HNSW index in RAM is the one that sets the bill.
SQL vs PL/pgSQL in PostgreSQL: Plan Caching
SQL vs PL/pgSQL functions in PostgreSQL 16: why a SQL function is re-planned on every loop call, how to reduce plan time.
ALTER FUNCTION SET work_mem: Fixing PostgreSQL Disk Spills Without a Global Change
Use PostgreSQL ALTER FUNCTION SET work_mem to stop one function's sorts spilling to disk without a global change. A production fix: 150 GB a day to 0.